Analyzing Encana's TMS Slide...
I like studying the presentation slides these companies put on their websites. I just find them difficult to understand.
Every industry has its own language and most companies within the industry seem to develop an unique internal language.
It makes it (intentionally?) hard to follow what the heck message they are supposedly attempting to get across. Sometimes they get frustrated when folks don't follow them, but, come on guys, does this crap esoteric information make sense to most people?
No.
So, I'm going to offer an analysis of one of the two TMS slides offered by EnCana yesterday as a part of its 2015 Capital Expenditure Budget (Otherwise known as a CapEx Budget).
This slide is copied below and my analysis follows.
Feel free to correct or clarify where my fumbling grasp of the subject matter is off base.
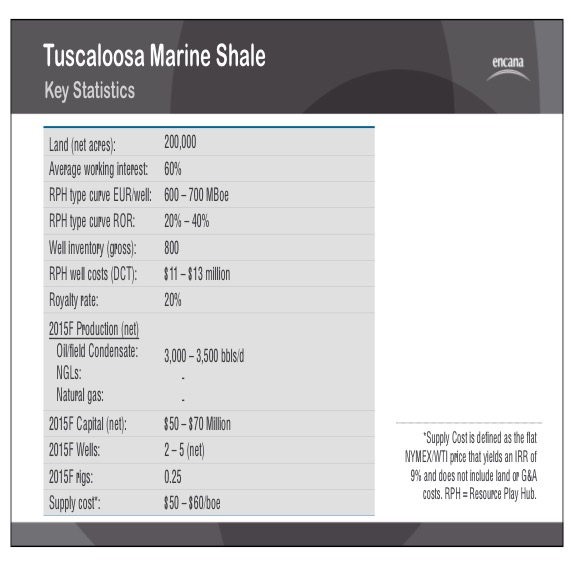
So, first up, how can EnCana have "Land (net acres): 200,000," but only have an "Average working interest: 60%" in this acreage? When did they sell a 40% working interest in their acreage? I missed that memo...if you got it, help us understand what this working interest comment means and who is the other owner of the 40% working interest, please.
"RPH type curve EUR/well: 600-700 MBoe"
"RPH" means Resource Play Hub and is a term used by EnCana to mean a multiple well pad...or, so I think. If anyone has a better understanding of this, please share.
I am confused by the implication that a RPH well would have any different "EUR" (estimated ultimate recovery) than a single well would have. Maybe the point is that as we read on down about "RPH" we are to understand they are talking about 600-700 "M" (thousand) "Boe" (barrels of oil plus an equivalent energy value in gas.)
"RPH type curve ROR: 20-40% ROR"
"ROR" means Return on Revenue, I think. But, I'm confused. Does this return on revenue of 20-40% act as a kind of gross margin. In other words, they are expecting to earn 20-40% net for every dollar of income? Assuming this is what they are trying to say, then I remain confused, but I'll share why later.
"Well inventory (gross): 800" - This is a conservative figure. This is assuming 4 wells per 1,000 acres and I believe 8 wells per 1,000 acres is still very possible. So, a gross well number of 800-1600 (200 thousand acres X 4 or 8) might be more informative.
"RPH well costs (DCT): $11-$13 million"
Okay...."RPH" we believe to mean "resource play hub" or multiple well pad drilling/completion. The process of drilling multiple wells and completing multiple well more or less at one time saves a substantial amount of money per well.
"(DCT)" is a term I've seen, but haven't attempted to understand until now. It also appears to be unique to EnCana and I cannot find it explained anywhere. I'm guessing it means (Drill, Complete, Tie-in). In other words, the costs for production equipment (tanks, pumps, flaring, separators, etc...) is not included.
"$11-$13 million" - EnCana stated in a presentation shortly after its 3rd quarter report that the budget at the time for these wells was $14.2 million, but that the last few wells had come in under budget. So, it would appear that with the RPH savings we've moved to a new cost level that, with decent prices ($80+), would clearly make the TMS a commercial play.
Royalty rate: 20% - Even I understand this one! The pay-out for royalties on their holdings amounts to 20% of the sales price for production.
2015F Production (net) -I'm guessing the "F"means fiscal year, yet the "fiscal year" is also a calendar year for EnCana, so I may be wrong. "(net)" normally means EnCana's part of the production before royalty payments. So, I'm assuming this is what they mean in this case.
Oilfield Condensate: 3,000 - 3,500 bbls/d - I don't know what "oilfield condensate" means, but it is obvious to me they expect to produce crude oil. The "3,000-3,500 bbls/d" means to me that they expect to produce on average 3,000 + barrels per day of oil for 2015. Since they should enter the year producing around 7,000 barrels a day and should be producing that or more by the end of the 1st quarter of 2015, the production by the end of the year will likely be less than 2,000 barrels per day. I certainly hope this is a very low ball estimate.
I'm going to skip all but the last item on the slide as self-explanatory or irrelevant.
The last line Supply Cost*: $50-$60 boe is actually explained (sorta) off to the side. What it means to me is that they believe they can now produce the oil for less than $60 a barrel. That's a good thing, but if you go to the presentation and look at other "supply cost" numbers for other plays you will see lower numbers. So, we still have some improvements to make. The fact that we generally get a little more for our oil and that our transporation costs are lower than some plays is helpful, but I would think we can get this down to less than $50.
Okay...that's it for me...jump in and get me straight folks!